Sencha provides a specialized instance of Sencha Web Application Client that enables remote debugging for developers on Android and iOS. Sencha Web Application Client takes much of the pain out of debugging HTML5 applications across platforms.
We created a custom Chromium-based webview for the new release of Sencha Web Application Client for Android. Now, any application deployed in Sencha Web Application Manager on Android 4.0 and above will have the same high-performance, feature-complete web runtime. In addition, developers will have a single version of Chrome to target and be able to debug on any Android 4.x device instead of the highly fragmented environment Android provides today.
Source Maps
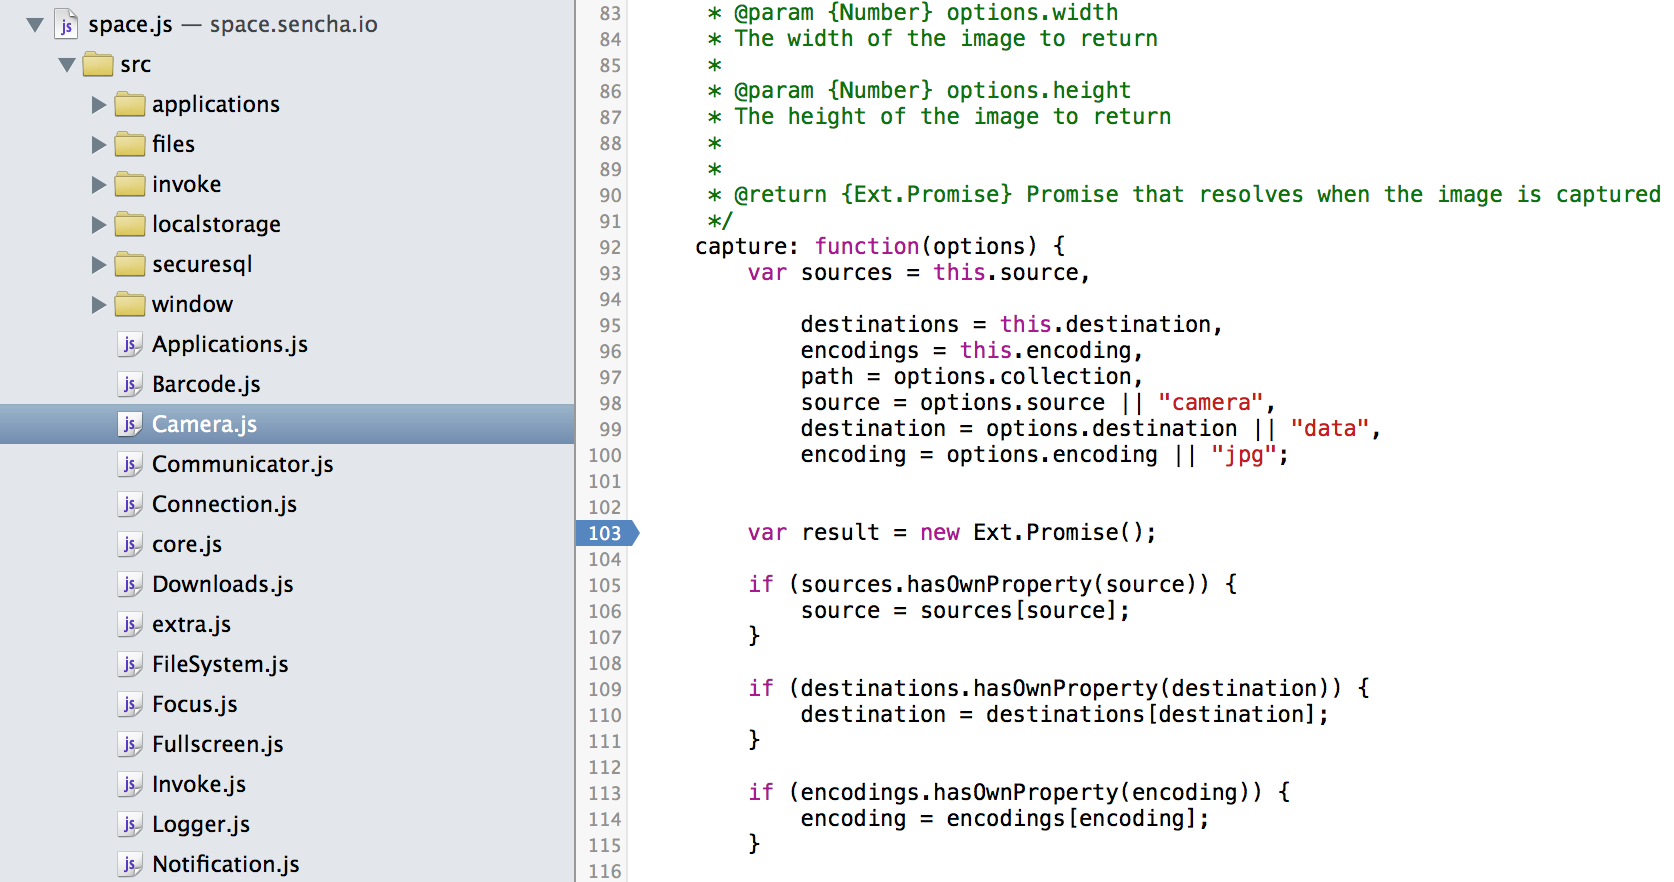
When you include space.js in your application we return a highly compressed javascript file. Normally developers have to switch between a debug version of an SDK and a compressed version of the same SDK when moving to production. To eliminate the need to switch the url when you move your application to production we include Source Maps for space.js so that when debugging you can set breakpoints in the Sencha Web Application Client SDK and see exactly what is going on in stack traces. Both Android and iOS debug clients support source maps.
Android Debugging
Google has made developing web or hybrid applications on Android difficult for developers. Each version of Android has included a Webkit-based webview that lacked many advanced HTML5 features and had significant performance issues. Using the standard webview, developing a web application for Android involves testing, debugging, and working around Android’s many platform incompatibilities and performance limitations. In addition, prior to Android 4.4, the webview did not support remote debugging, making this process particularly challenging.
Sencha Web Application Client simplifies web application debugging by providing a webview that supports remote debugging on all versions of Android 4.
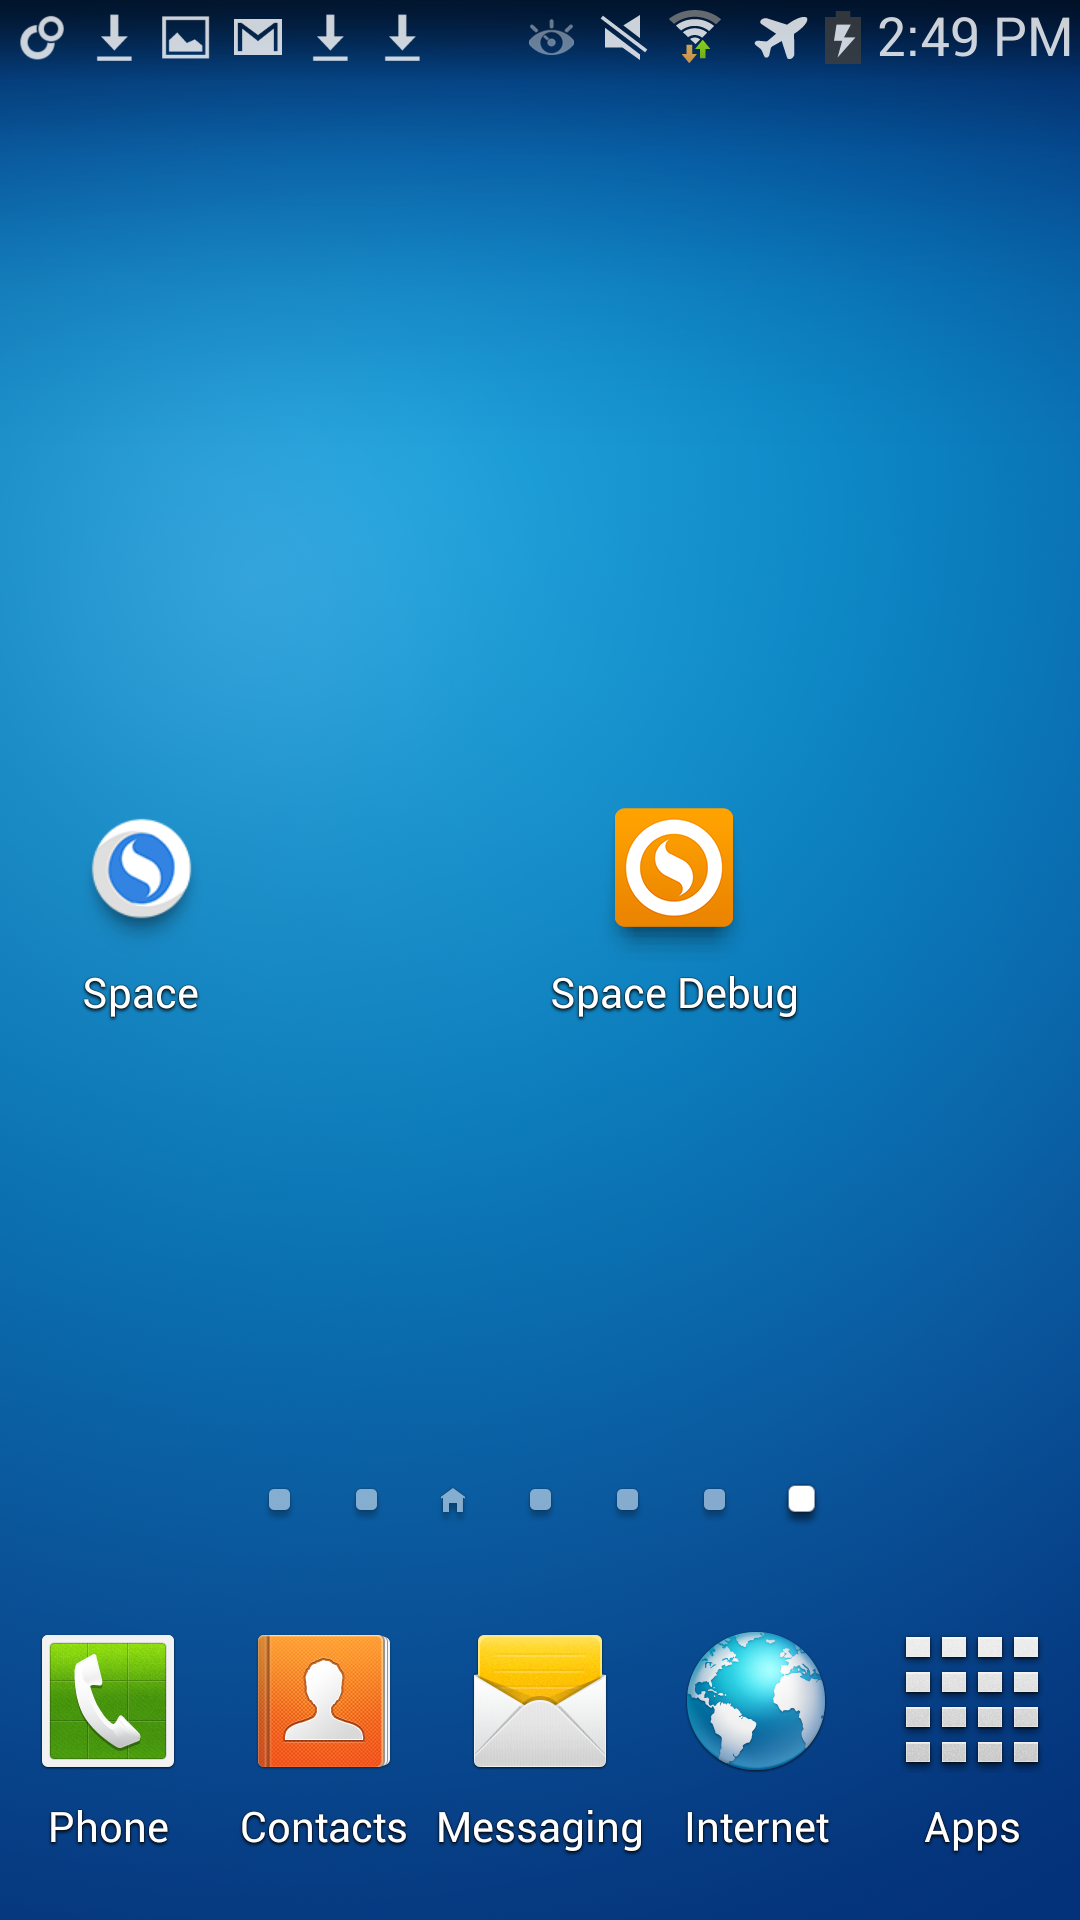
Because Sencha Web Application Manager is a security-focused product, we disable debugging for the production Sencha Web Application Client you can download from the Play Store. Instead, we provide a developer version of the Sencha Web Application Client for Android that developers can install directly on their Android devices via this url:
The debug client can be installed on the same device as the version from the Play Store. All data from each version of the app is isolated so it won’t impact production data.
Next, if you haven’t done any debugging on this device before, follow the instructions to enable remote debugging with Chrome: https://developer.chrome.com/devtools/docs/remote-debugging
Now that you have enabled remote debugging on your device, if you haven’t already done so, connect your device to your computer with a USB cable.
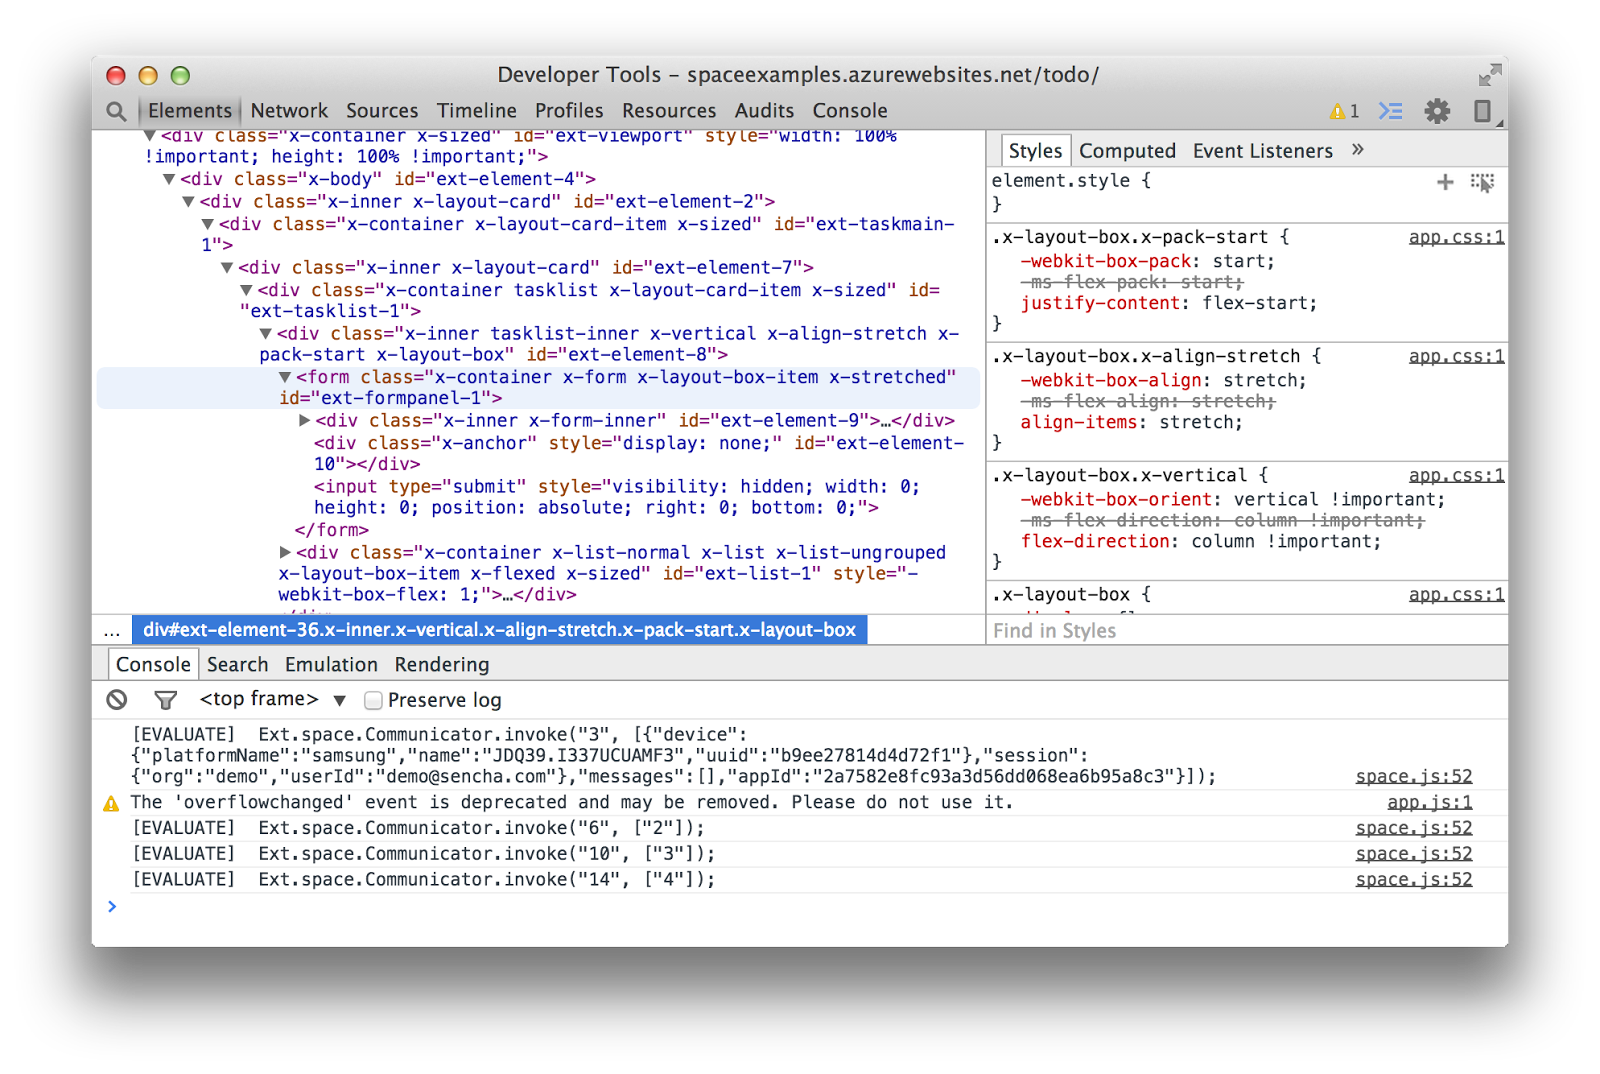
Open Google Chrome on your computer and navigate to chrome://inspect
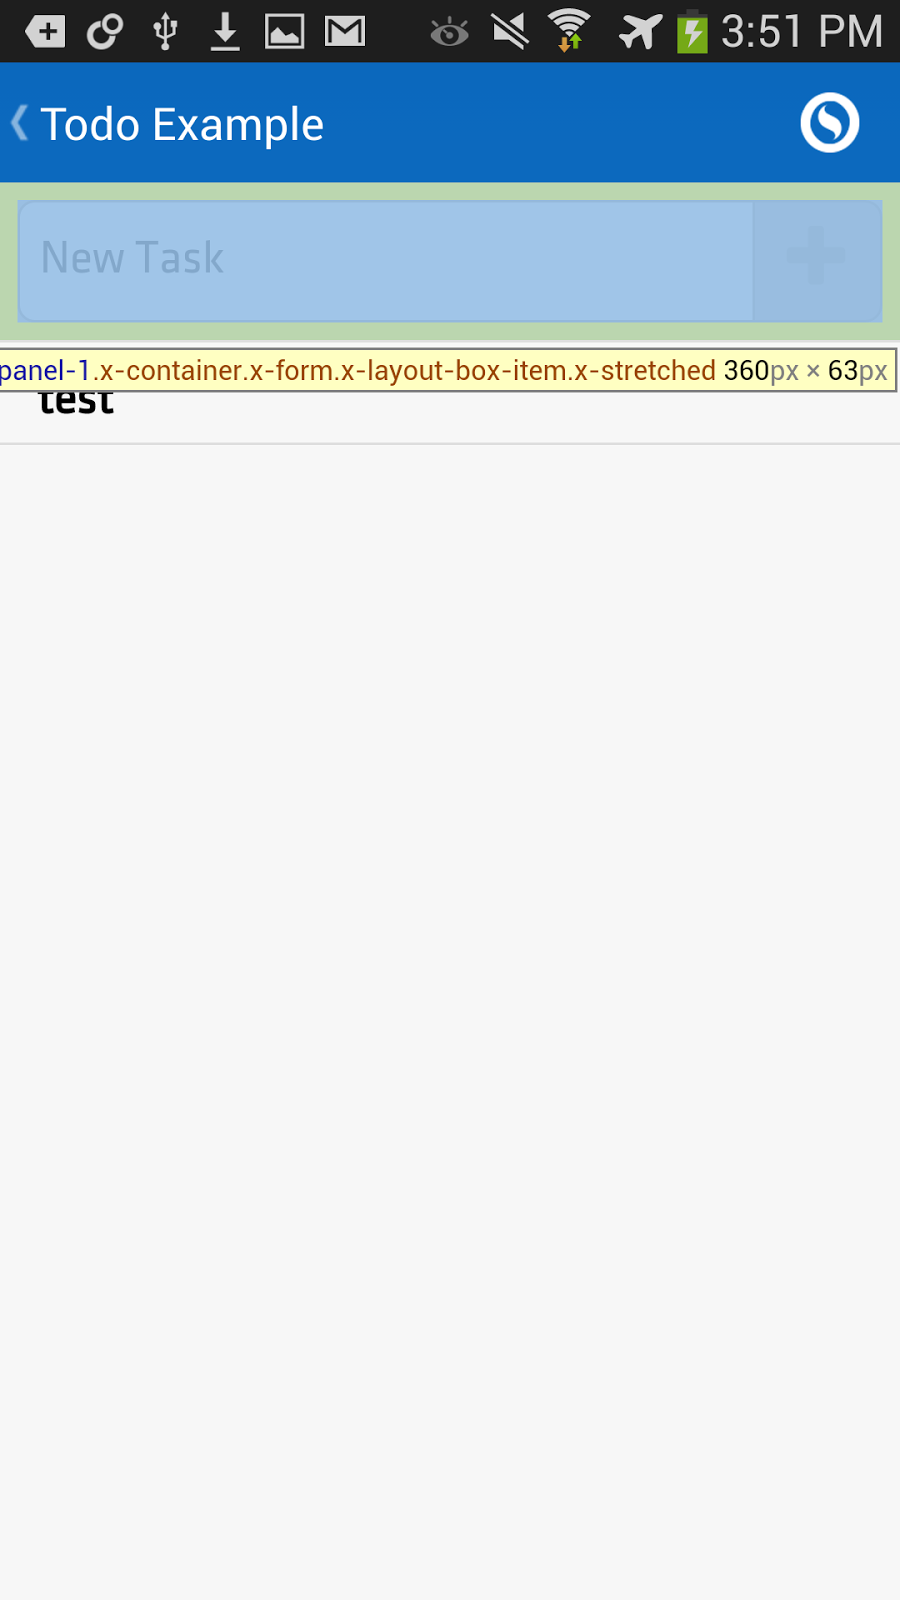
Open Sencha Web Application Client on your Android device and login to your organization.
Now you should be able to see each Sencha Web Application Client application’s webview in Chrome’s remote inspector.
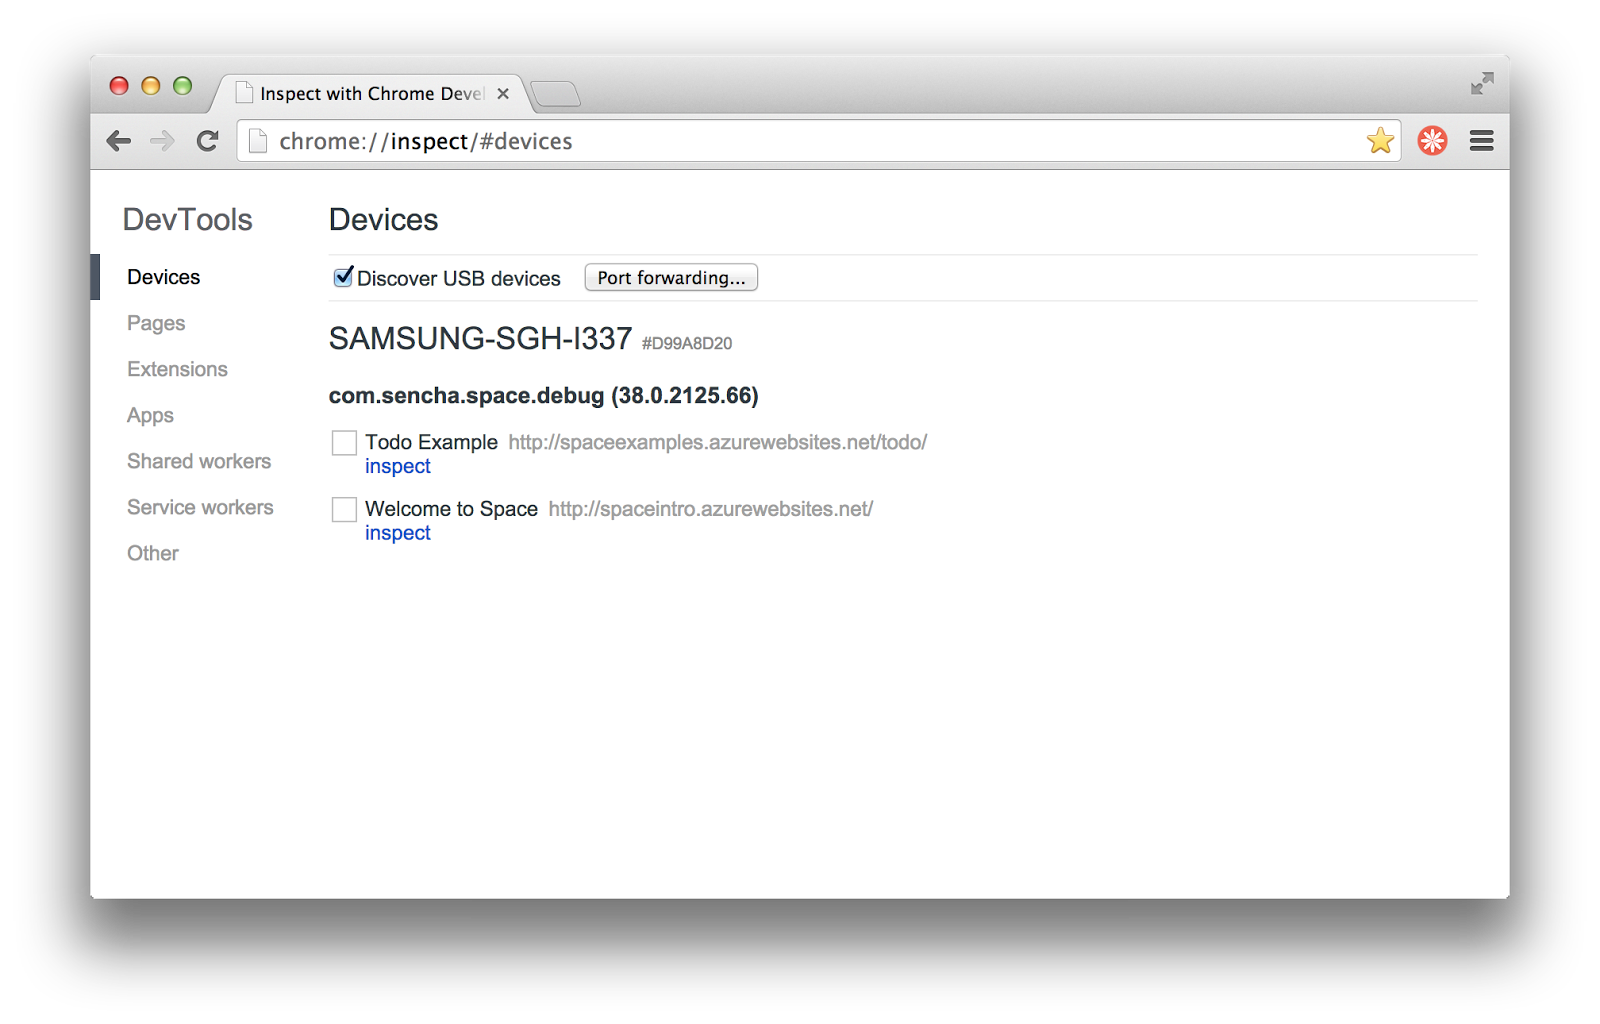
Sencha Web Application Client runs each application in its own webview. If you open more than one application in Sencha Web Application Client, each one will be listed in Chrome’s inspector. You can also debug each application concurrently, even when it is not the active webview in Sencha Web Application Client.
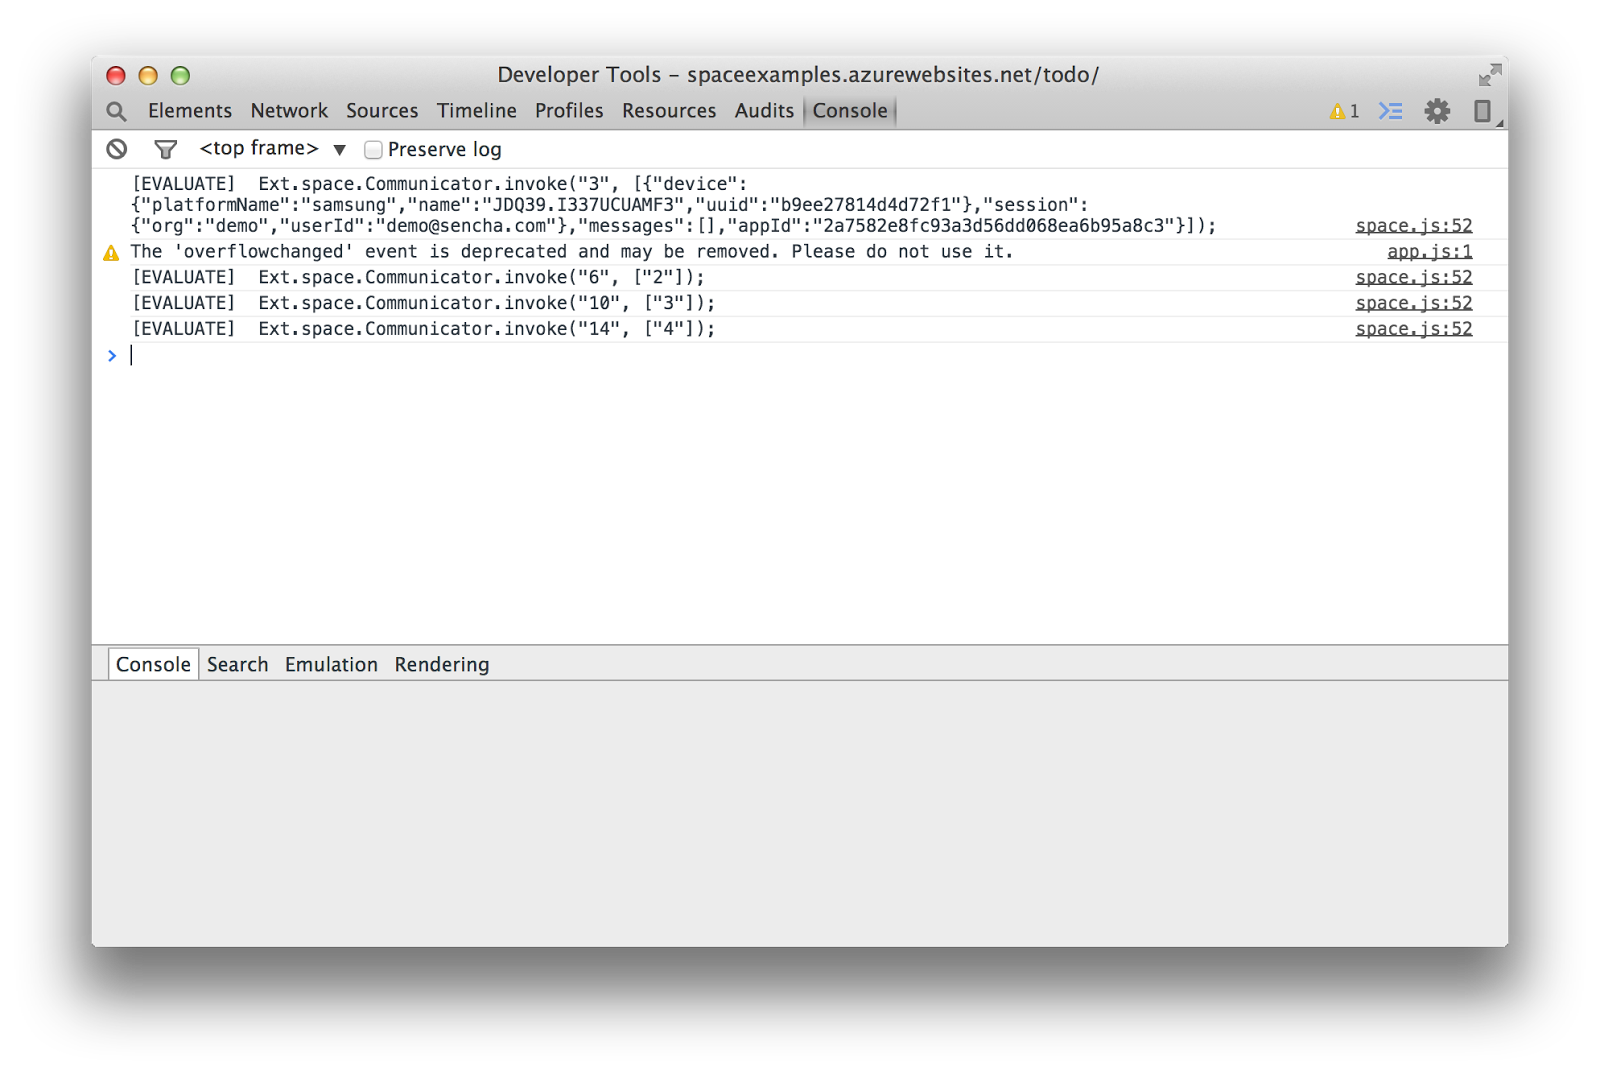
Once you open the inspector, you have access to all the debugging capability provided by the chrome dev tools.
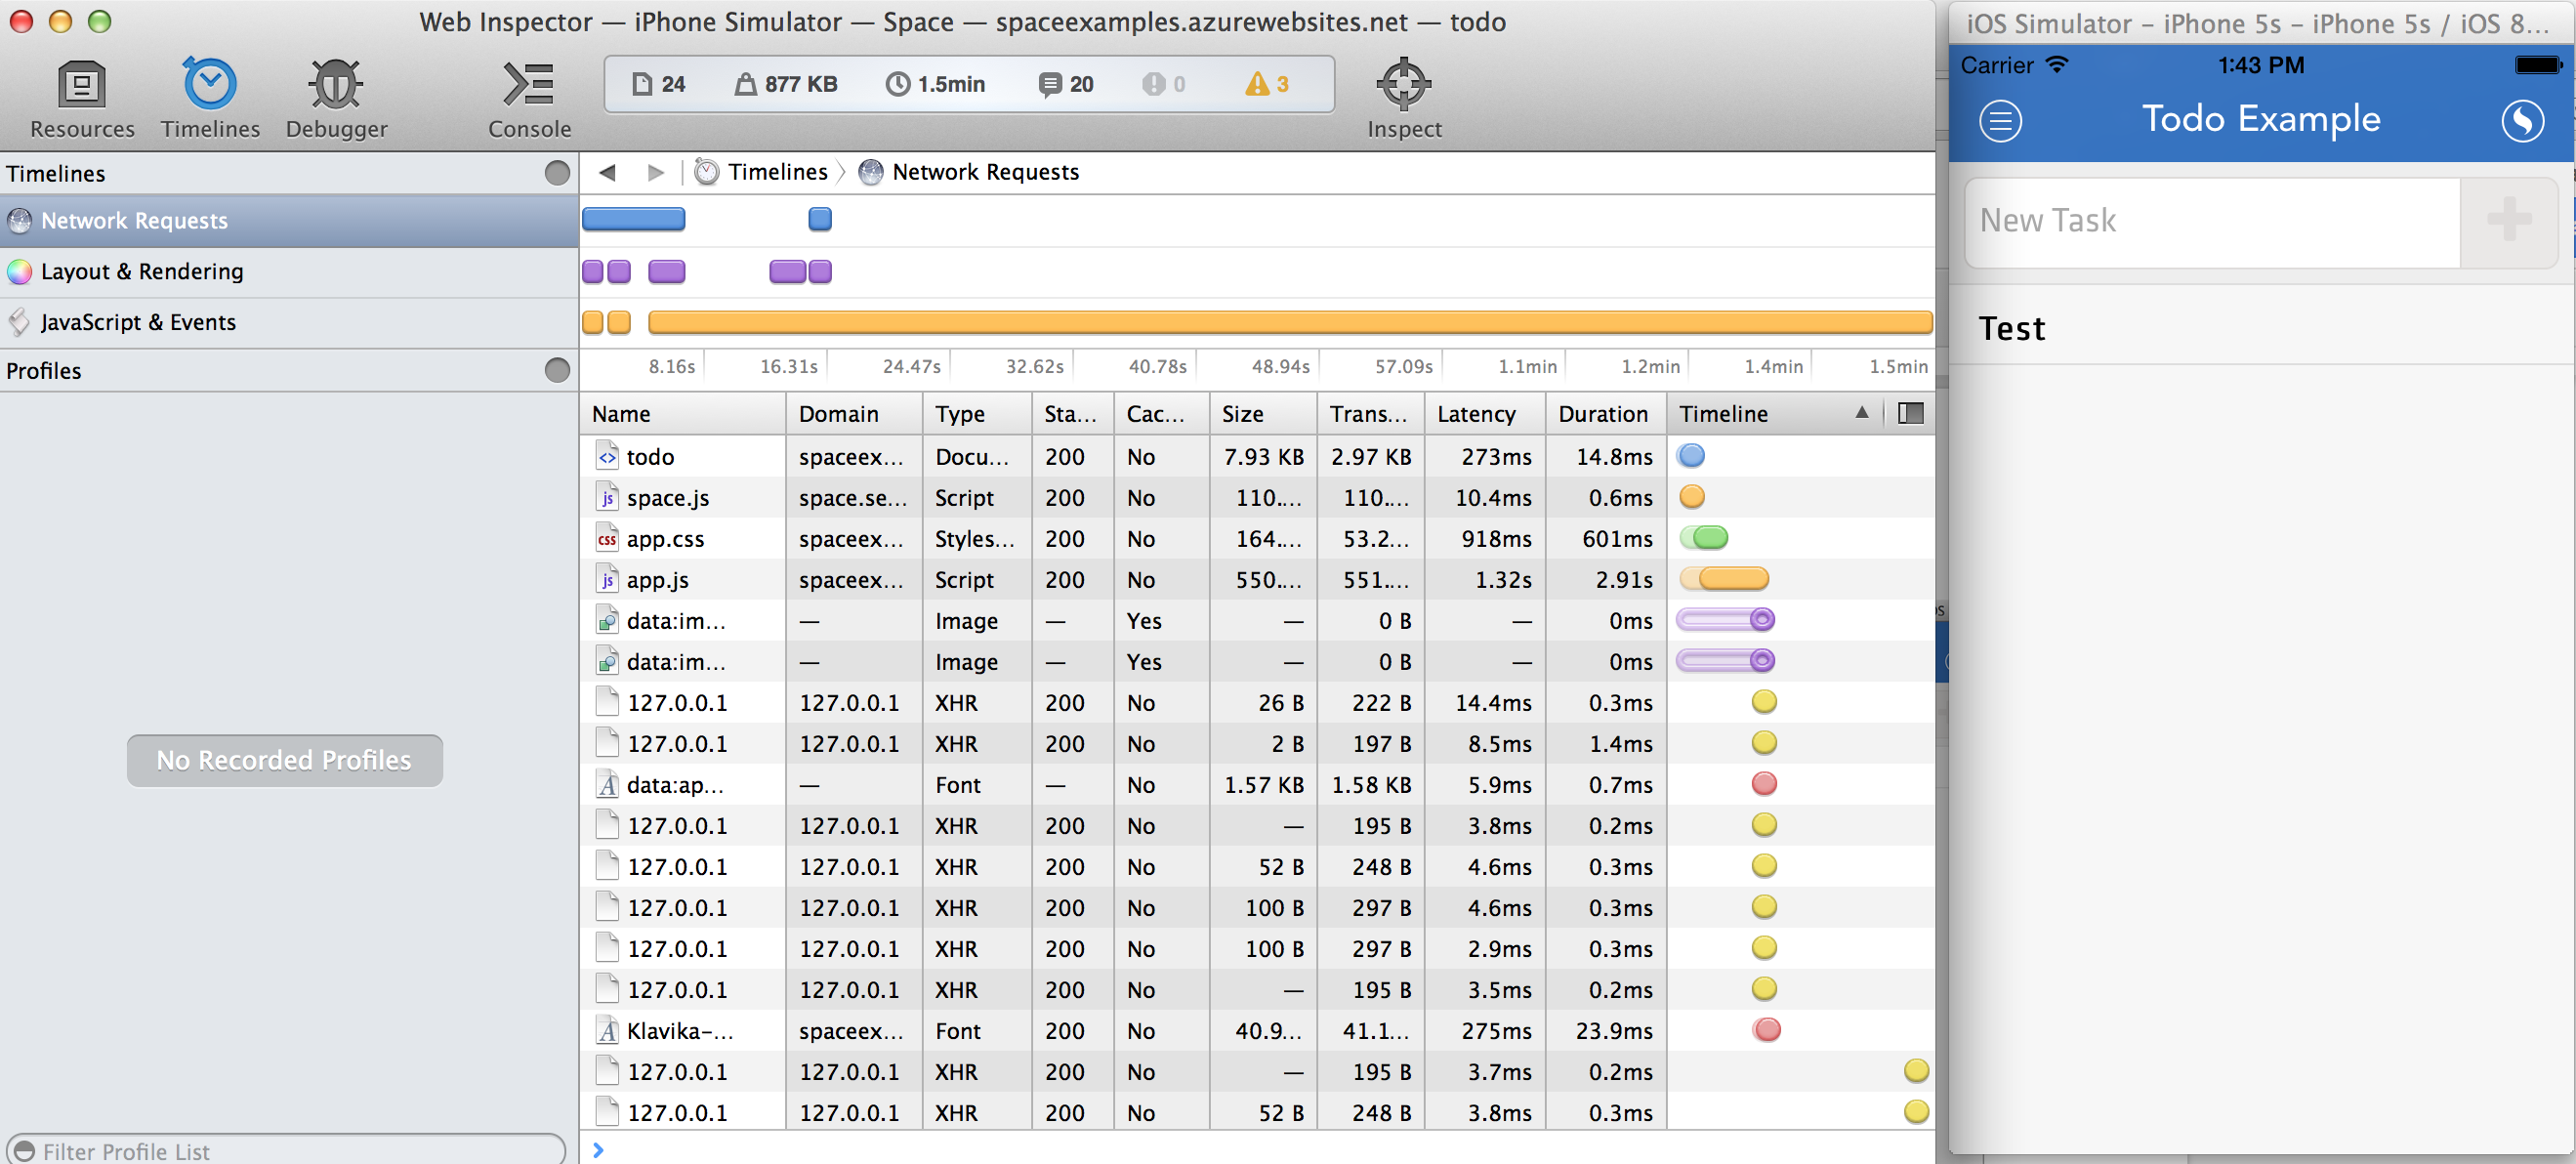
iOS Debugging
Apple makes it easier for Mac based web developers to debug web applications in mobile Safari. Apple’s Xcode is a free download for anyone with a mac. Most developers will already have xcode installed on their development machines. The ios simulator is a great way to quickly debug your mobile webapps.
Like our Android client we now provide a debug client for the iOS simulator. You can debug your Sencha Web Application Client applications directly on your mac without the need for access to iOS devices.
ios-sim can be installed via npm, and the source is available on github. If you don’t have npm and node installed on your system you will need to do that first.
From the command line:
npm install ios-simDownload the Sencha debug client and extract the archive:
Now from the command line install the app with ios-sim
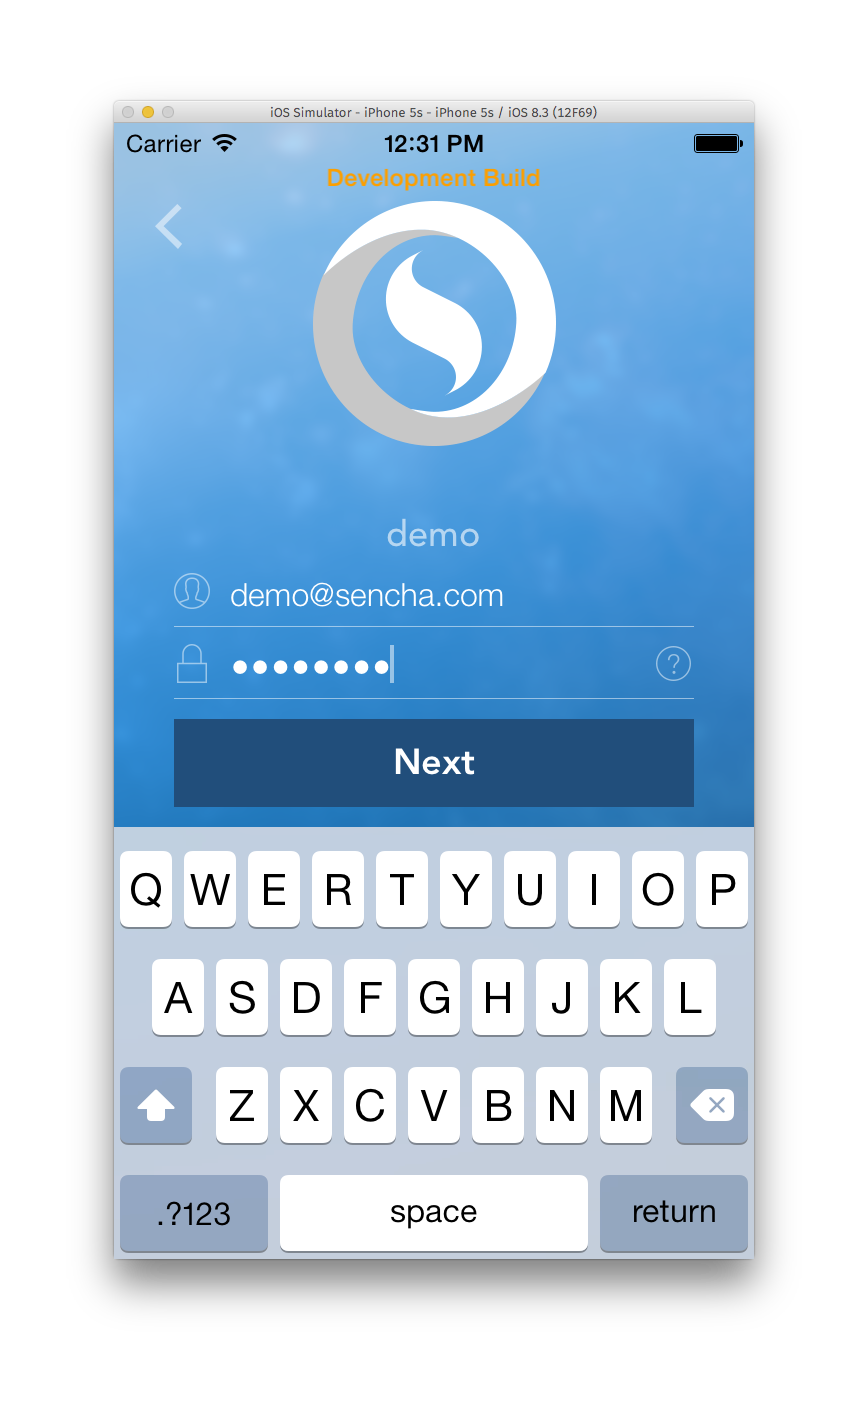
ios-sim launch [PATH To Sencha]/sencha-wam-ios-debug/Wam-Dev.app --devicetypeid com.apple.CoreSimulator.SimDeviceType.iPhone-6Now login to the org with your credentials and open a Sencha Web Application.
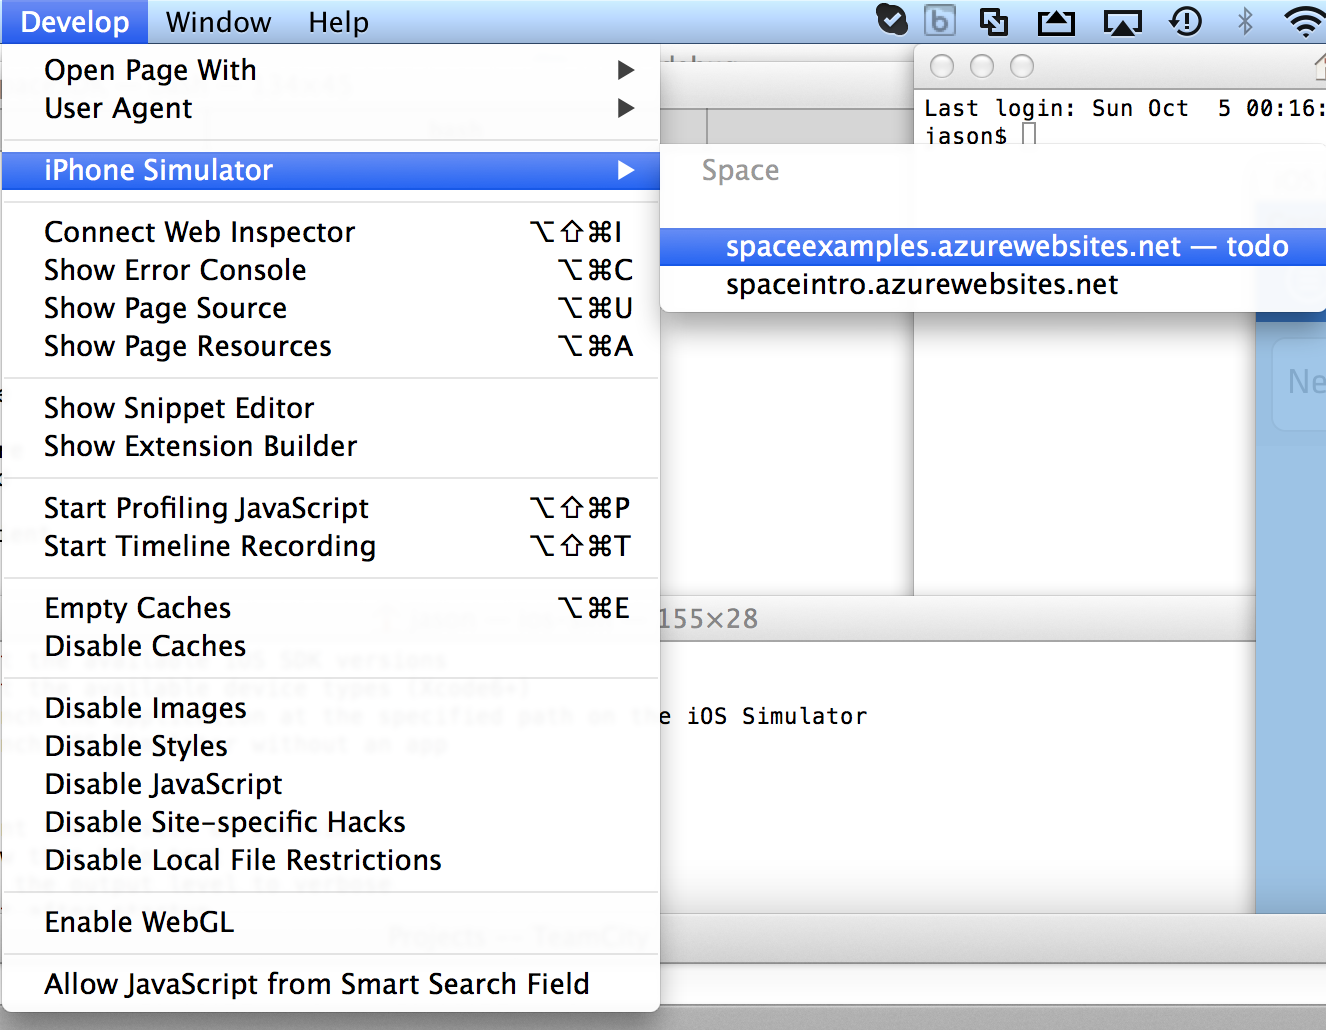
Now open Safari, open the debug menu. You should see an iPhone Simulator menu item and a list of all of the active webviews running in Sencha Web Application Client
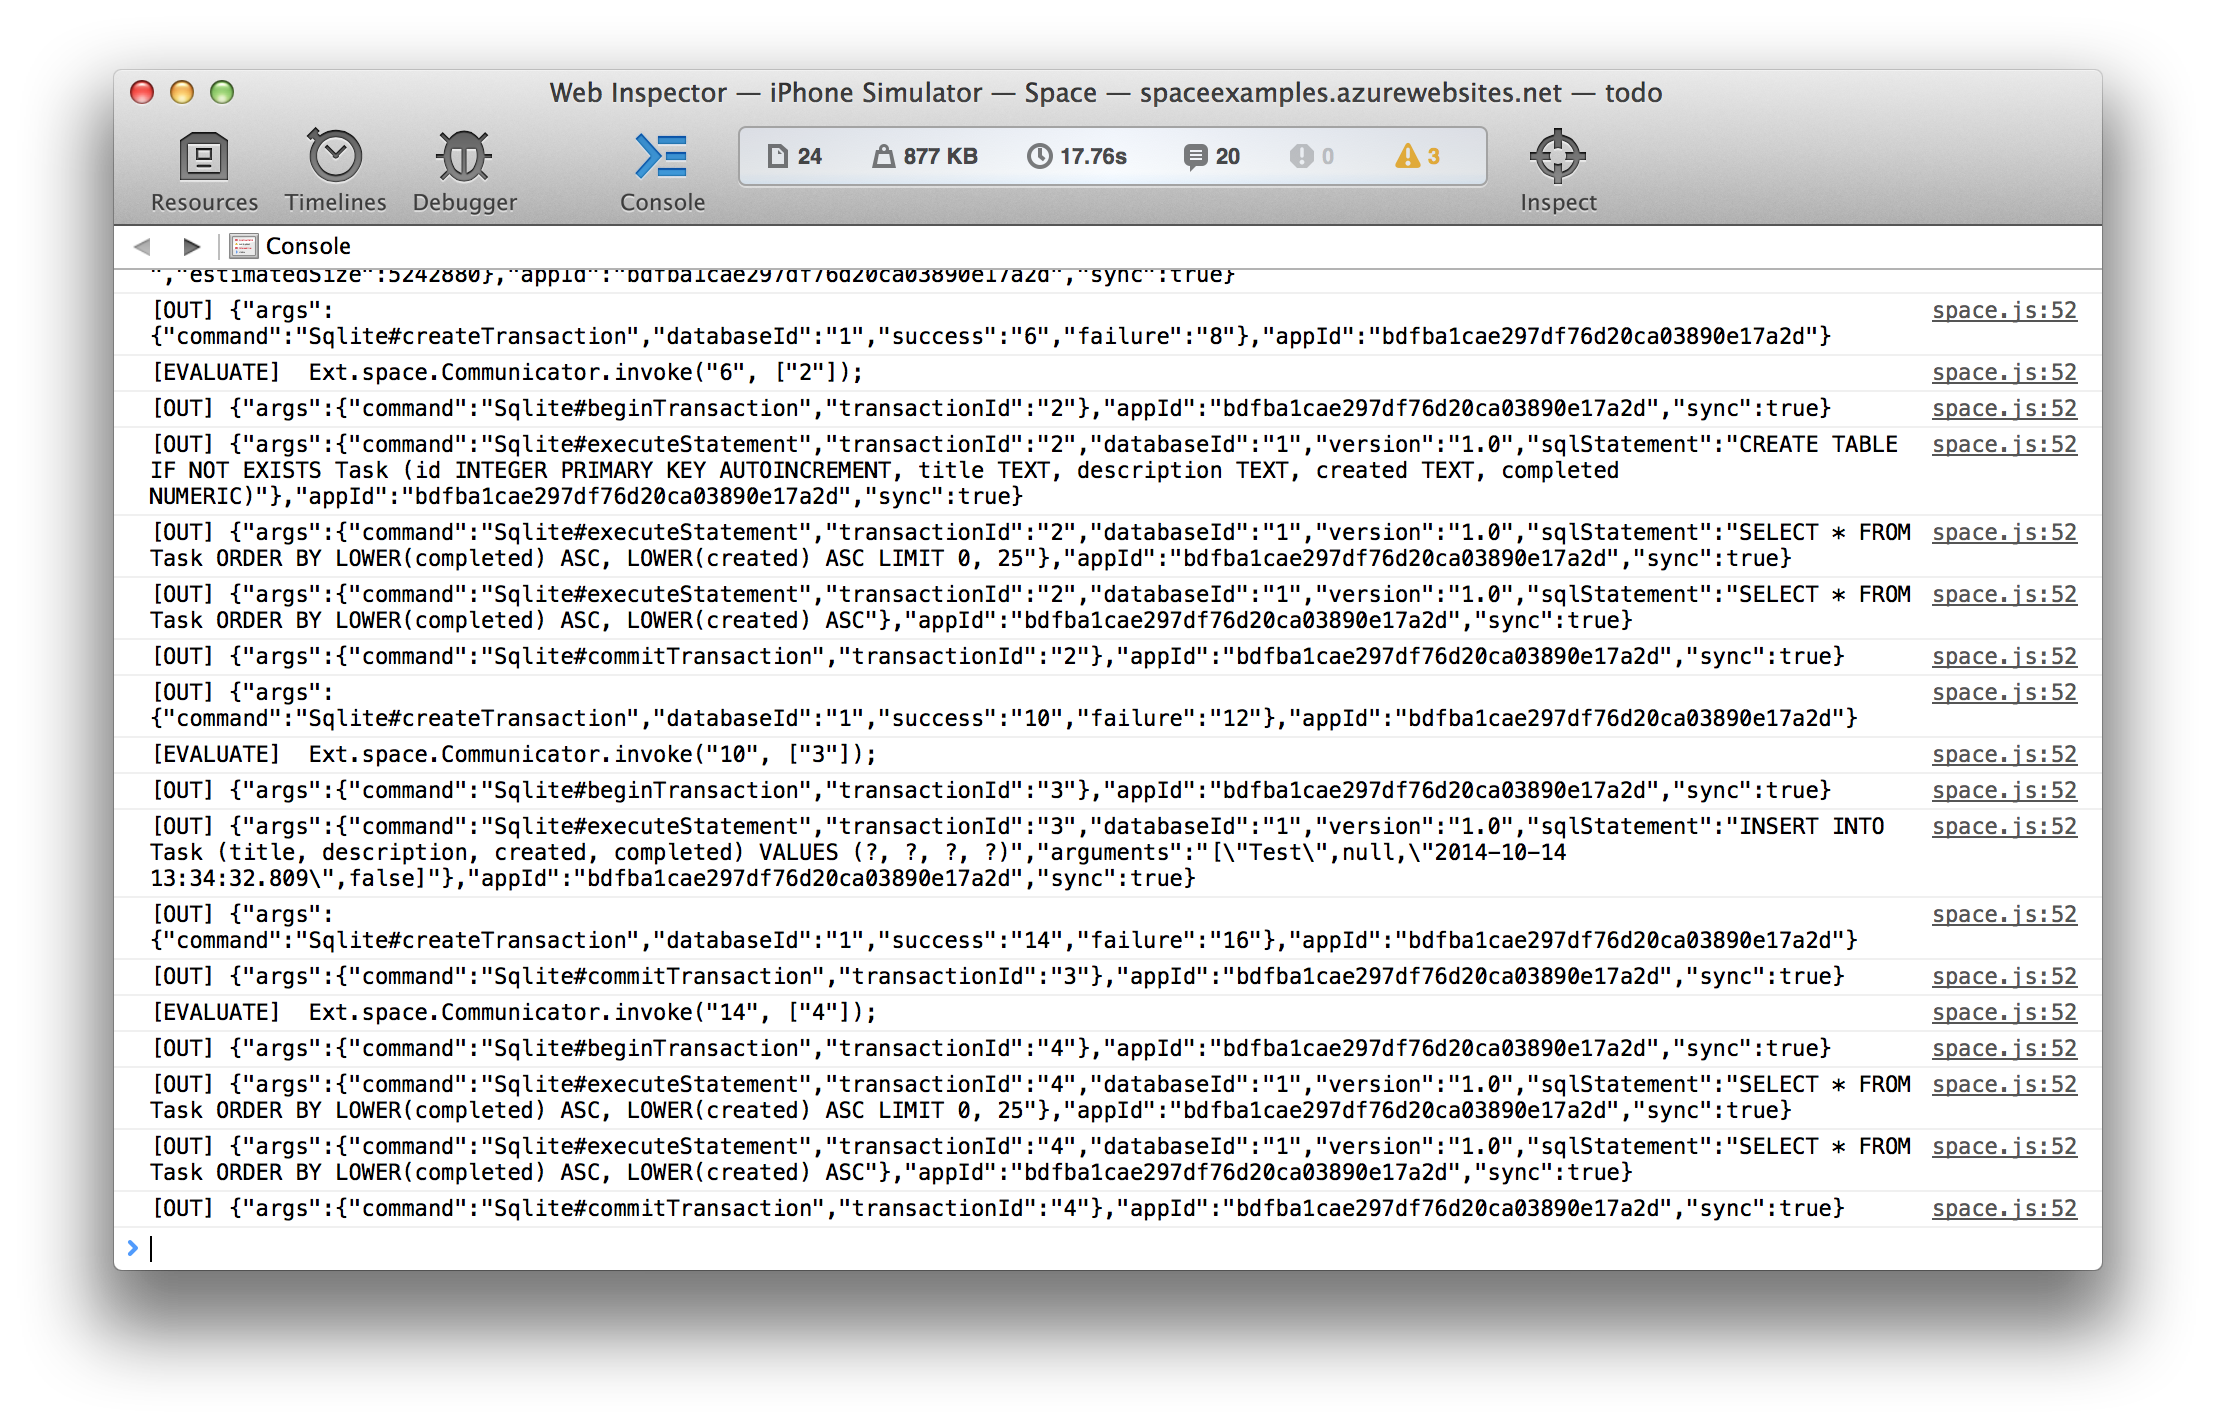
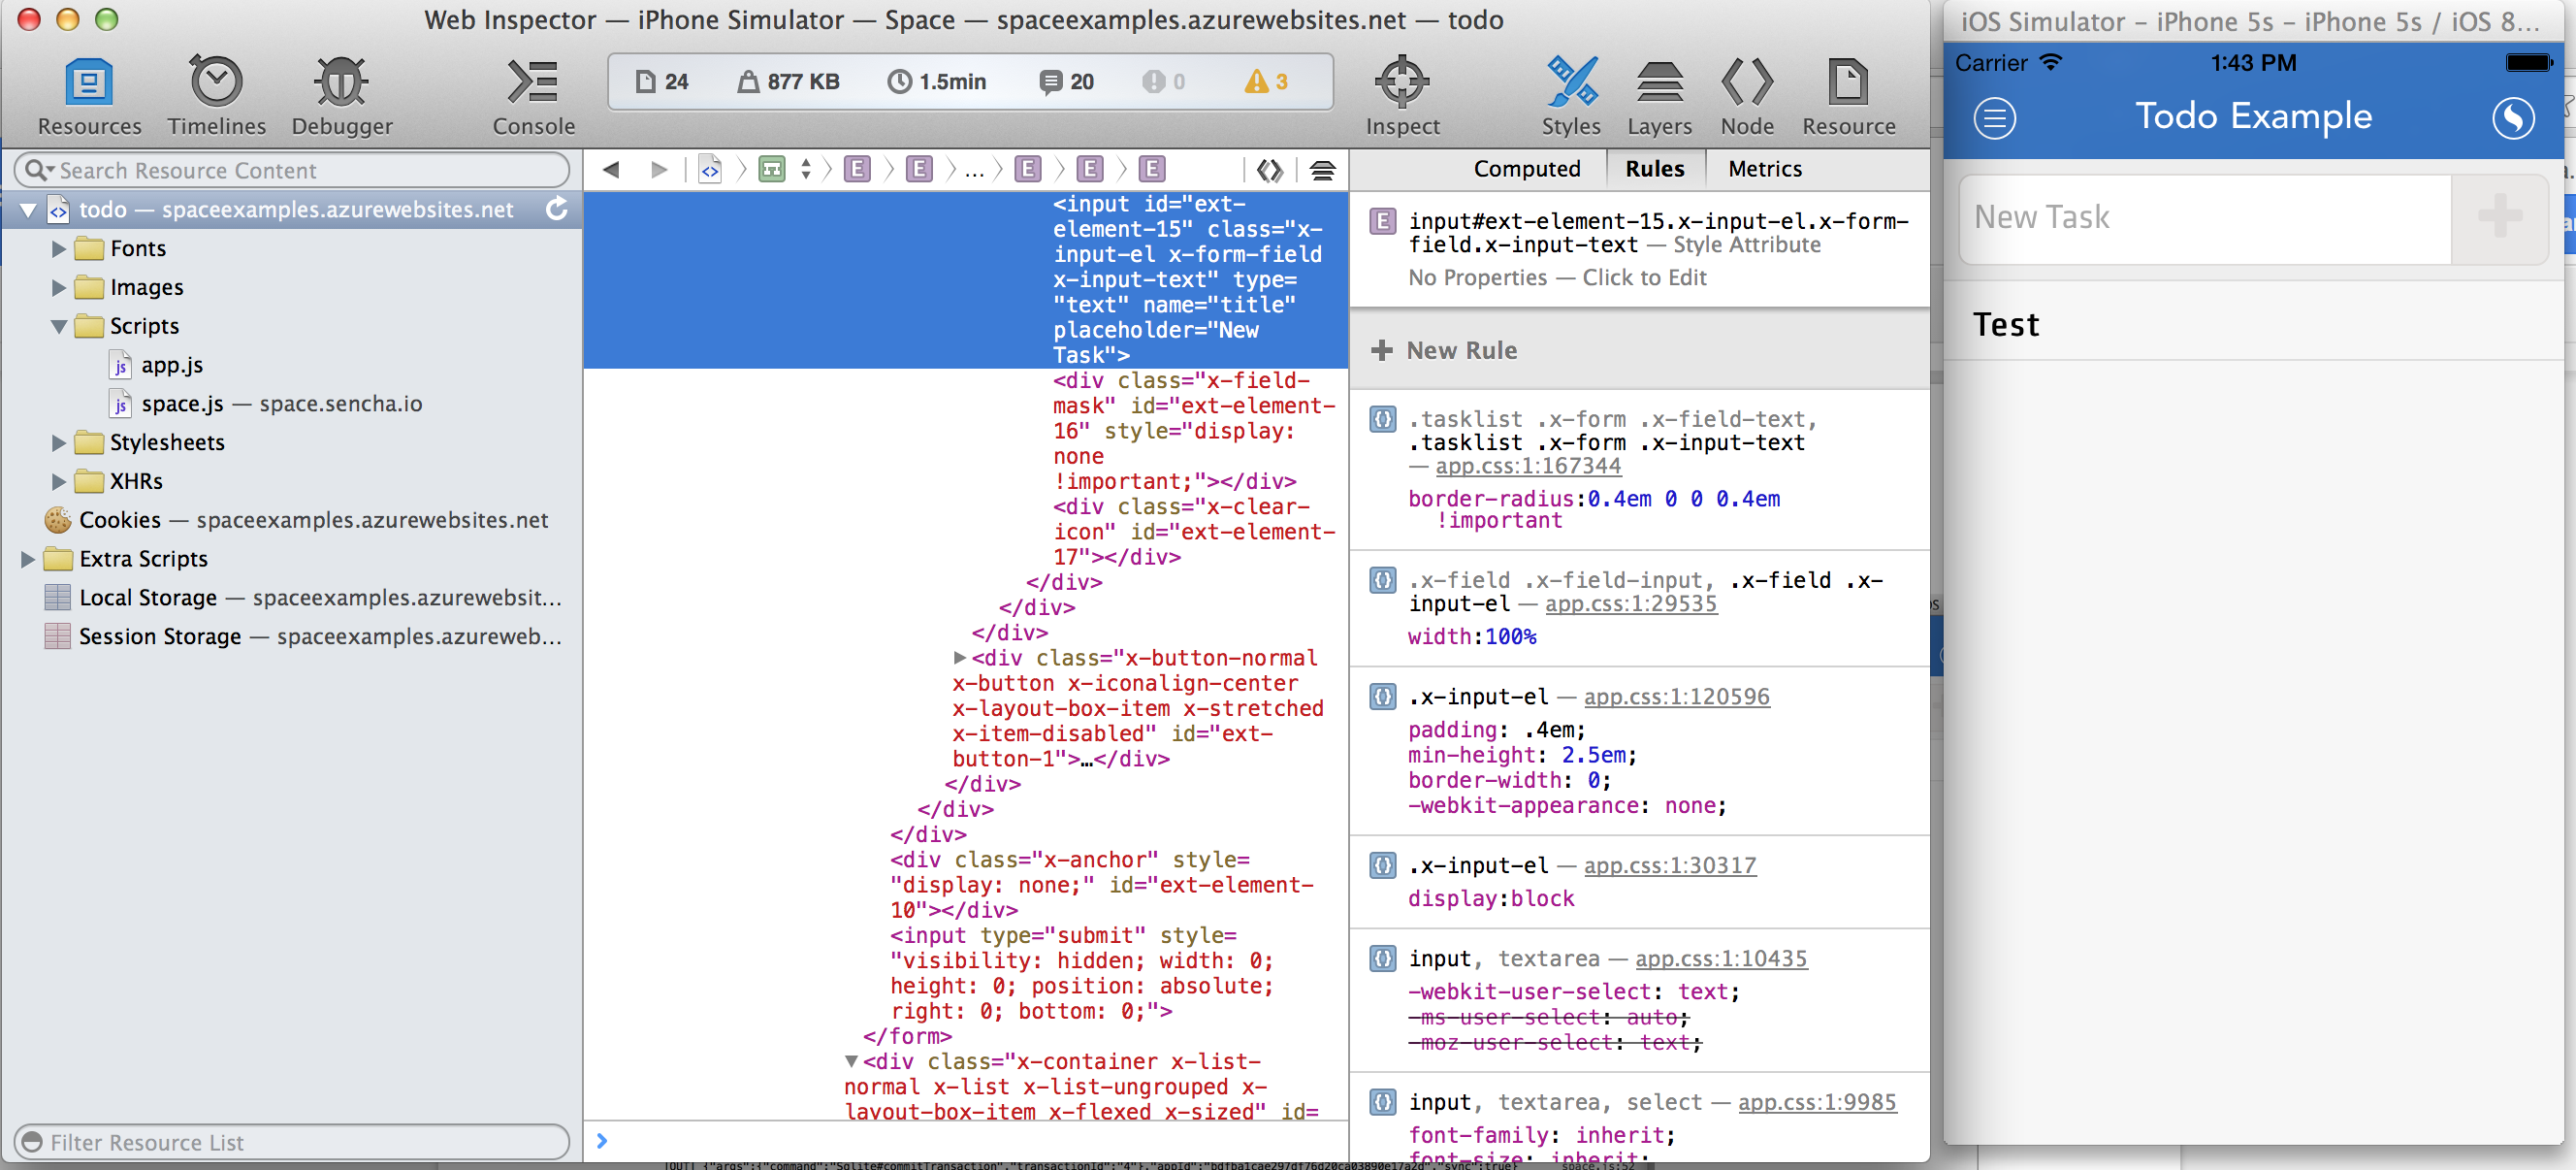
Select the application from the list and Safari’s web inspector will launch. If you have already debugged applications in Mobile Safari before then you will already be familiar with its capabilities: You can see the JS console, see the loaded resources, set breakpoints in javascript, inspect the dom, and execute javascript directly from the debugger.
Apple’s iOS simulator provides a very high-quality reproduction of iOS using the simulator. However, some problems require real hardware to uncover severe bugs. If you are a paid Apple developer, we will be be providing access to a debug client that you can run on iOS devices. We are currently testing this client with a select group of partners and customers. If you would like early access to the hardware debug client, please contact us.