Sencha Test Overview
Many classes have shortcut names used when creating (instantiating) a class with a
configuration object. The shortcut name is referred to as an alias (or xtype if the
class extends Ext.Component). The alias/xtype is listed next to the class name of
applicable classes for quick reference.
Framework classes or their members may be specified as private or protected. Else,
the class / member is public. Public, protected, and private are access
descriptors used to convey how and when the class or class member should be used.
Public classes and class members are available for use by any other class or application code and may be relied upon as a stable and persistent within major product versions. Public classes and members may safely be extended via a subclass.
Protected class members are stable public members intended to be used by the
owning class or its subclasses. Protected members may safely be extended via a subclass.
Private classes and class members are used internally by the framework and are not intended to be used by application developers. Private classes and members may change or be omitted from the framework at any time without notice and should not be relied upon in application logic.
static label next to the
method name. *See Static below.Below is an example class member that we can disect to show the syntax of a class member (the lookupComponent method as viewed from the Ext.button.Button class in this case).
Let's look at each part of the member row:
lookupComponent in this example)( item ) in this example)Ext.Component in this case). This may be omitted for methods that do not
return anything other than undefined or may display as multiple possible values
separated by a forward slash / signifying that what is returned may depend on the
results of the method call (i.e. a method may return a Component if a get method calls is
successful or false if unsuccessful which would be displayed as
Ext.Component/Boolean).PROTECTED in
this example - see the Flags section below)Ext.container.Container in this example). The source
class will be displayed as a blue link if the member originates from the current class
and gray if it is inherited from an ancestor or mixed-in class.view source in the example)item : Object in the example).undefined a "Returns" section
will note the type of class or object returned and a description (Ext.Component in the
example)Available since 3.4.0 - not pictured in
the example) just after the member descriptionDefaults to: false)The API documentation uses a number of flags to further commnicate the class member's function and intent. The label may be represented by a text label, an abbreviation, or an icon.
classInstance.method1().method2().etc();false is returned from
an event handler- Indicates a framework class
- A singleton framework class. *See the singleton flag for more information
- A component-type framework class (any class within the Ext JS framework that extends Ext.Component)
- Indicates that the class, member, or guide is new in the currently viewed version
- Indicates a class member of type config
- Indicates a class member of type property
- Indicates a class member of type
method
- Indicates a class member of type event
- Indicates a class member of type
theme variable
- Indicates a class member of type
theme mixin
- Indicates that the class, member, or guide is new in the currently viewed version
Just below the class name on an API doc page is a row of buttons corresponding to the types of members owned by the current class. Each button shows a count of members by type (this count is updated as filters are applied). Clicking the button will navigate you to that member section. Hovering over the member-type button will reveal a popup menu of all members of that type for quick navigation.
Getting and setter methods that correlate to a class config option will show up in the methods section as well as in the configs section of both the API doc and the member-type menus just beneath the config they work with. The getter and setter method documentation will be found in the config row for easy reference.
Your page history is kept in localstorage and displayed (using the available real estate) just below the top title bar. By default, the only search results shown are the pages matching the product / version you're currently viewing. You can expand what is displayed by clicking on the button on the right-hand side of the history bar and choosing the "All" radio option. This will show all recent pages in the history bar for all products / versions.
Within the history config menu you will also see a listing of your recent page visits. The results are filtered by the "Current Product / Version" and "All" radio options. Clicking on the button will clear the history bar as well as the history kept in local storage.
If "All" is selected in the history config menu the checkbox option for "Show product details in the history bar" will be enabled. When checked, the product/version for each historic page will show alongside the page name in the history bar. Hovering the cursor over the page names in the history bar will also show the product/version as a tooltip.
Both API docs and guides can be searched for using the search field at the top of the page.
On API doc pages there is also a filter input field that filters the member rows using the filter string. In addition to filtering by string you can filter the class members by access level, inheritance, and read only. This is done using the checkboxes at the top of the page.
The checkbox at the bottom of the API class navigation tree filters the class list to include or exclude private classes.
Clicking on an empty search field will show your last 10 searches for quick navigation.
Each API doc page (with the exception of Javascript primitives pages) has a menu view of metadata relating to that class. This metadata view will have one or more of the following:
Ext.button.Button class has an alternate class name of Ext.Button). Alternate class
names are commonly maintained for backward compatibility.Runnable examples (Fiddles) are expanded on a page by default. You can collapse and expand example code blocks individually using the arrow on the top-left of the code block. You can also toggle the collapse state of all examples using the toggle button on the top-right of the page. The toggle-all state will be remembered between page loads.
Class members are collapsed on a page by default. You can expand and collapse members using the arrow icon on the left of the member row or globally using the expand / collapse all toggle button top-right.
Viewing the docs on narrower screens or browsers will result in a view optimized for a smaller form factor. The primary differences between the desktop and "mobile" view are:
The class source can be viewed by clicking on the class name at the top of an API doc page. The source for class members can be viewed by clicking on the "view source" link on the right-hand side of the member row.
Sencha Test is a critical piece of the Sencha Platform that helps developers and test engineers achieve new levels of quality in their applications while providing a much-needed productivity boost throughout the testing effort. Sencha Test does this by bringing together the best Open Source testing libraries (such as Jasmine, WebDriver and Istanbul), adding the missing pieces and integrating everything in one comprehensive solution.
Sencha Test consists of two applications: Sencha Studio (for the GUI) and stc or "Sencha Test Command" (for the command line). Both applications provide the ability to execute tests, however, Sencha Studio provides a graphical, interactive test runner while stc provides a scriptable test runner suitable for unattended use in Continuous Integration (CI) systems such as Jenkins or TeamCity. These applications also collaborate to provide powerful test result archiving and reviewing capabilities that go beyond the build logs and linear views provided by the CI.
Sencha Studio uses a Workspace to organize tests as either a stand-alone project (when application code is unavailable) or alongside the applications and packages they support. Sencha Studio can integrate with your Sencha Cmd applications as well as with applications that do not use Sencha Cmd.
You can write tests directly in Sencha Studio using its built-in text editor, or you can use your own preferred IDE or text editor. Sencha Studio's text editor offers code completion and assistance that is aware of Jasmine (the test framework included in Sencha Test) and the Sencha Test API.
Tests, like application files, are typically kept in a version control system (such as Git, Subversion, etc.). This is true even in a stand-alone test project for backup and team collaboration reasons.
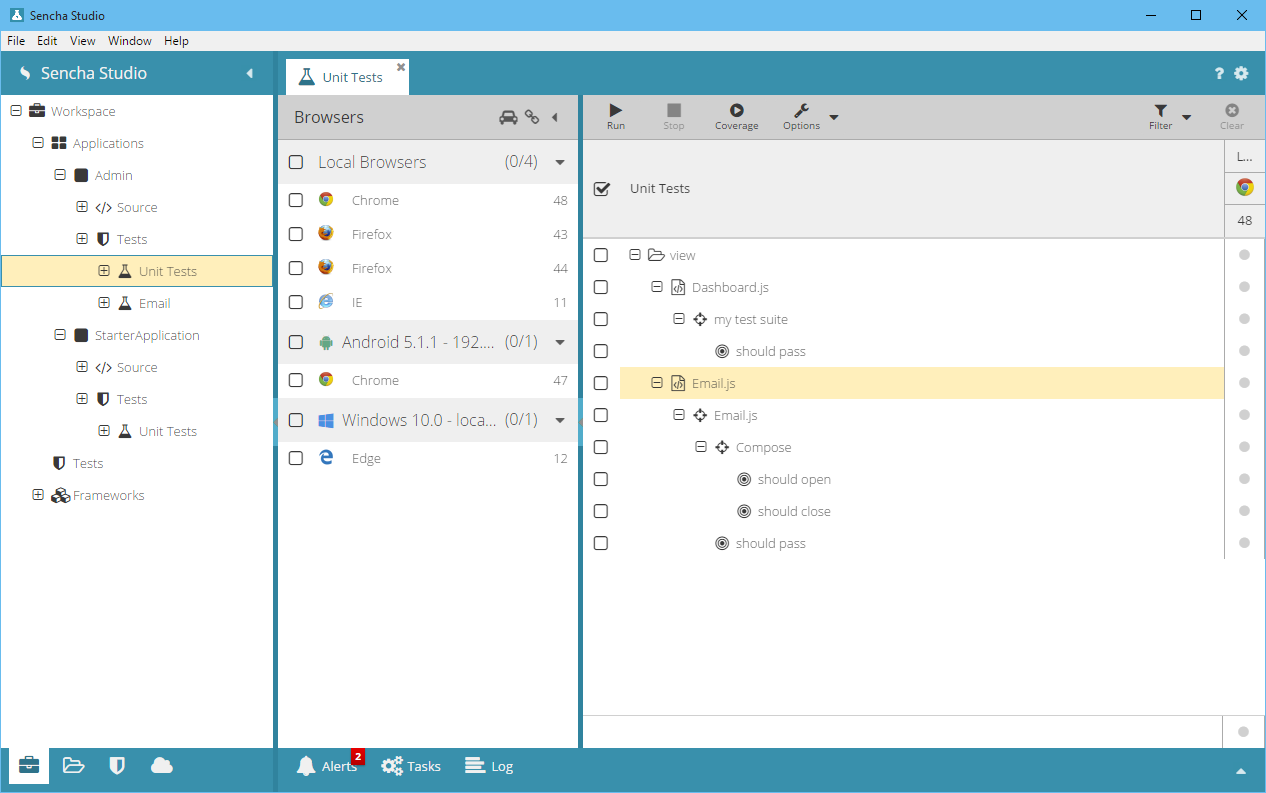
The cornerstone of Sencha Test is its test runner, which makes the interactive test runner the most essential component of Sencha Studio. The test runner is designed to be used during all phases of development. This iterative process helps developers deliver robust applications because each piece can be easily tested as it is being built.
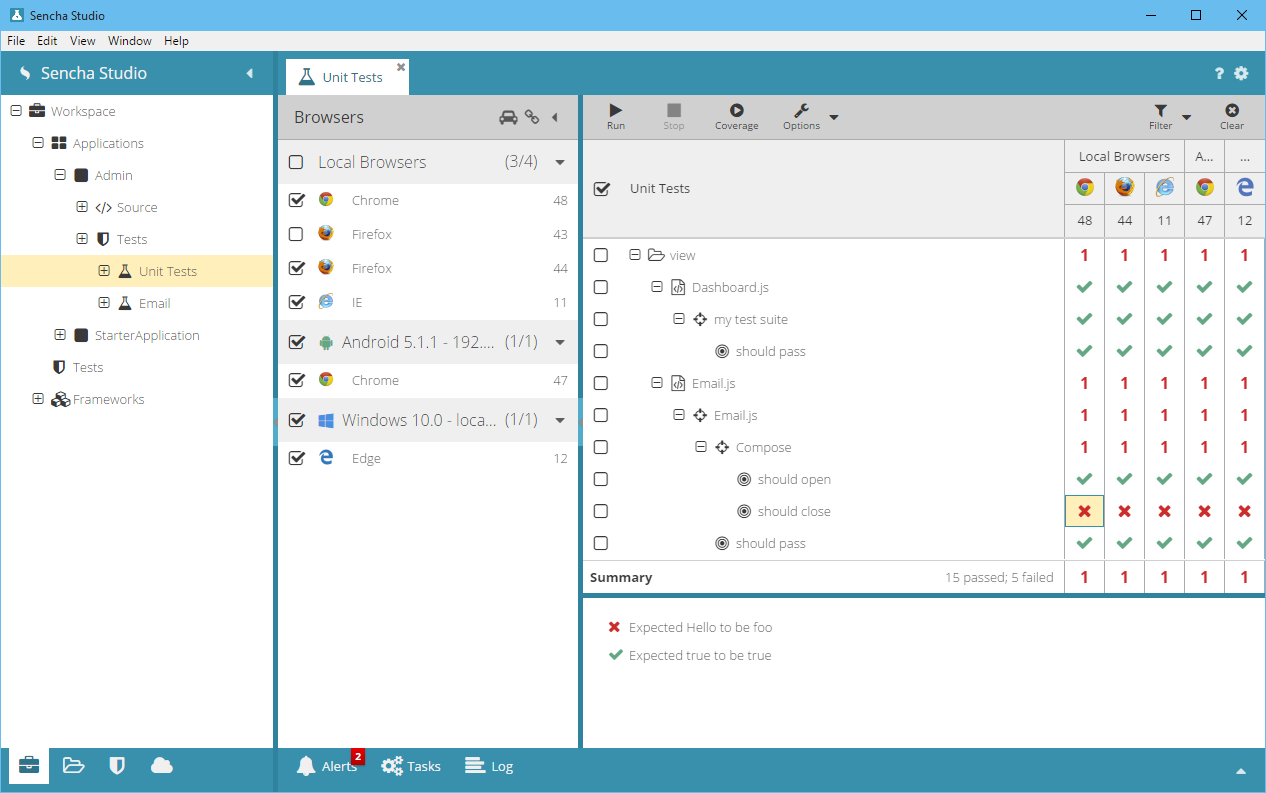
The test runner allows the developer or test engineer to select specific tests, execute them in parallel against multiple browsers and see the results in real-time.
Once the tests are in source control, they can be run unattended in a CI system using the Sencha Test Command (stc). The test configurations, displayed and edited by Sencha Studio, are seamlessly used by the command-line test runner. This combination of a CI and stc enables test runs to be easily triggered by changes in source control, or on a regular cycle such as every night.
Tests run at the command line use WebDriver to manage the required browsers. Sencha Test supports the use of a local WebDriver hub as well as connecting to a cloud-based provider such as Sauce Labs or BrowserStack.
Test results are captured by the CI using stc's various output options and can also be uploaded to the Sencha Test Archiver. Using Sencha Studio, archived test results can be reviewed using the same graphical format as the interactive test runner.
The Sencha Test Archiver is a Node JS-based web server provided by stc. The archiver (or "archive server") is typically installed on a designated machine in the CI environment. A single archive server can be configured to handle any number of teams and projects. Alternatively, multiple archive servers can be installed as needed.
Beyond the test runner, Sencha Test provides a number of important features designed to make testing simple and productive.
Sencha Studio streamlines the setup and configuration required to get started writing and running tests. This starts with the workspace as the organizational root and continues with the configuration of Test Projects and Test Scenarios. Sencha Studio allows developers to configure all aspects of the test run from the location of the test subject, to the inventory of tests and the various run-time options. All of these settings can be verified in the interactive test runner before moving on to the CI system.
Maintaining the vast number of browser combinations required for real-world testing is not always possible or desirable. Sencha Test comes with out-of-the-box support for browser farms like Sauce Labs and BrowserStack so developers and test engineers do not have to become IT specialists in order to run their tests. These solutions can also drastically reduce test execution time, as tests can be run simultaneously on multiple browsers with minimal effort.
Sencha Test understands Sencha Frameworks. The Sencha Test API provides numerous features to minimize the effort required to test Ext JS and Sencha Touch applications. While most test frameworks (including Jasmine) are synchronous by nature, Sencha Test provides an API family called the "Futures API's" that recognize the asynchronous nature of GUI testing.
Using the Futures API, complex sequences of GUI interactions can be expressed in a simple, compact way. Under the hood, Sencha Test ensures that the steps of the test are properly scheduled without assistance from the test author in typical cases. For example:
ST.grid('#userGrid').               // locate a grid via component query
    rowWith('firstName', 'Bill').   // and select the row w/matching field
        cell('lastName').           // then select a cell given a column id
            reveal().               // scroll to this cell
            textLike('Preston');    // -> wait for the text to match a pattern
If the cell does not have the desired text within a timeout period (which can be set to 0), the test will fail.
The Futures API provides many more Ext JS Component-aware methods as well as API's for dealing with primitive DOM elements. Validation logic can be easily added to the sequence of events and custom wait conditions can be inserted with equal simplicity.
Using Sencha Studio's built-in text editor, users can launch the Event Recorder to quickly record and insert a sequence of events directly into their tests.
The Event Recorder will launch the application, run the current test and then record the stream of events as the user interacts with the application. These events can be edited and filtered before being inserted into the test.
Using the Event Recorder can save significant time getting test cases started. The recordings can be run without modification to ensure no errors were generated or they can be extended with custom expectations or assertions to ensure the correct information is displayed.
When test run results are saved to an archive server, Sencha Studio can download these results and display them in the same format as the interactive test runner: organized by folder (vertically) and by browser (horizontally). This format is much more time efficient than finding failure patterns by reading CI build logs.
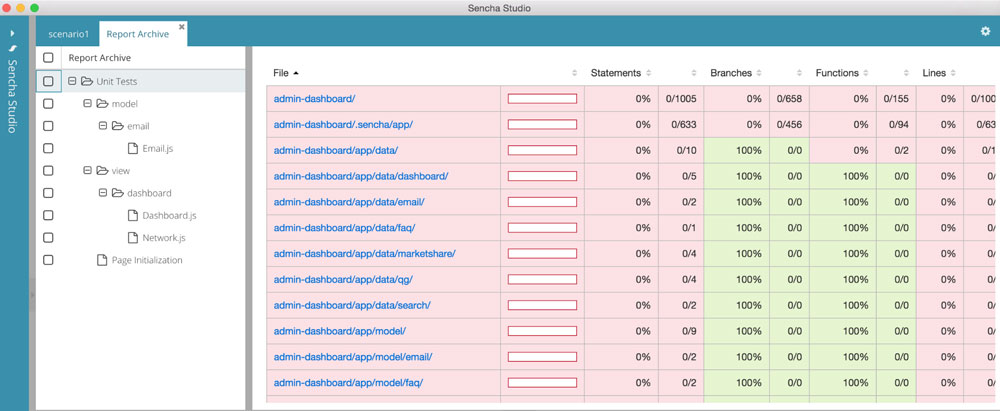
Beyond the pass/fail types of results, however, Sencha Studio allows developers and test engineers to review visual test results as well as code coverage.
Sencha Test also provides a simple means to verify correct application state by capturing
screenshots and comparing them to a baseline. This is as simple as calling the screenshot()
method at the appropriate time. The baseline (or expected) image is automatically established
the first time the test is run. Subsequent test runs will produce test failures if the
screenshot does not match the established baseline.
While computational tests are faster and typically preferred when they can be used, visual tests are at times the only way to test certain aspects of an application. For example, the outcome of CSS rules that set things such as color or text alignment, as well as highly visual components like charts.
Screenshots are captured during unattended test runs (via stc) using WebDriver. These are compared to the baseline obtained from the archive server and the results are stored in the archive server for later review in Sencha Studio. Sencha Studio is also able to update the baseline should the correct answer change over time.
Sencha Test contains an integrated version of Istanbul, a leading JavaScript code coverage tool, with which you can identify the gap in the amount of code that you have covered and not covered with your tests. Leveraging this integration, Sencha Test provides a detailed breakdown to the level of Statements, Branches, Functions, and Lines in a readable format with percentage analysis.
Using the code coverage report is a great way to reduce project risk due to critical code not being properly tested.
For instructions on installing and getting started with Sencha Studio refer to the Sencha Studio Installation & Setup guide. If you have further questions, concerns, or bug reports, please visit the Sencha Test forums.


 Sencha Test | Terms of Use
